

Fig1_page.pdf
Tavotto for Matplotlib
Edit figures visually. Keep scripts untouched.
Tavotto opens the figures matplotlib has already drawn: titles, legends, curves and the page layout are adjusted on the canvas. Each change is saved on its own; the script stays as it was.
A real figure, at the size it will print.
Choose a desktop version
Try it in your browser Intel Mac version Other versions and checksums
Free & Open Source · 100% Local Execution
Installing on Windows
Installing on Windows
Windows may display a SmartScreen warning because our open-source code-signing certificate is pending verification. Click "More info" → "Run anyway" to proceed.
All binaries are distributed via official GitHub Releases with verifiable SHA-256 checksums.
Once installed, Tavotto runs on your own machine. Your figures and scripts are not uploaded.
Click anything. See it clearly.
Native Matplotlib Hierarchy
Tavotto reads the figure as the objects matplotlib drew, not as pixels. Every title, tick label, axis and curve can be selected on its own.
-
axes_0.titleTitle -
axes_0.xlabelAxis label -
axes_0.ylabelAxis label -
axes_0.lines_0Line -
axes_0.lines_1Line -
axes_0.legendLegend -
axes_0.xticksTick set -
axes_0.yticksTick set
Live Visual Tweaks
Adjust font sizes, line weights, stroke styles, or positioning on the fly. Matplotlib re-renders the underlying figure instantly.
Try it on a sample, or your own .py. axes_0.title Title
fontsize
9.0 → 12.0 pt
Non-Destructive Sidecar Overrides
Every edit is recorded beside the figure; the Python file is not modified. Re-run the script in Tavotto with new data and the edits are applied again.
restoring 1 edit identical
fig1_kinetics.py
-
"""示例 1:两条动力学曲线 + 图例(最典型的可参数化面板)。 -
-
在 Tavotto 里双击这张图,可以直接点中标题、坐标轴标签、图例、任意一条曲线, -
改字号/颜色/线宽或拖动位置——改动存成 override,本文件一个字都不会被动。 -
""" -
import numpy as np -
-
import matplotlib.pyplot as plt -
from paper_style import COL_1, PALETTE, save -
-
-
def main(): -
t = np.linspace(0, 60, 200) -
fast = 1 - np.exp(-t / 8) -
slow = 1 - np.exp(-t / 24) -
-
fig, ax = plt.subplots(figsize=(COL_1, COL_1 * 0.72)) -
ax.plot(t, fast, color=PALETTE[0], lw=1.2, label="Catalyst (k = 0.125 $\\mathrm{min^{-1}}$)") -
ax.plot(t, slow, color=PALETTE[1], lw=1.2, ls="--", label="Blank (k = 0.042 $\\mathrm{min^{-1}}$)") -
ax.set_xlabel("Reaction time (min)") -
ax.set_ylabel("Conversion") -
ax.set_title("Reaction kinetics") -
ax.set_xlim(0, 60) -
ax.set_ylim(0, 1.05) -
ax.legend(loc="lower right") -
save(fig, "Fig1_kinetics") -
-
-
if __name__ == "__main__": -
main()
fig1-overrides.json
{ "index": 0, "patch": { "gid": "axes_0.title", "prop": "fontsize", "value": 12.0 }, "hash_after": "sha256:56591382a70626624a8df4ae9a5a17a9358e0844f65a030f2bd0d36ee6905bb9", "warnings": [], "moved_gids": [ "axes_0.title" ], "bbox_after": { "axes_0.title": [ 0.32596875, 0.03180555555555542, 0.37306249999999996, 0.06730855305989585 ] }}
Millimeter-Accurate Multi-Panel Layout
Panels (a), (b) and (c) are laid out on one page measured in millimetres; this one is 150 × 112.5 mm. Scale a panel and its type scales with it.
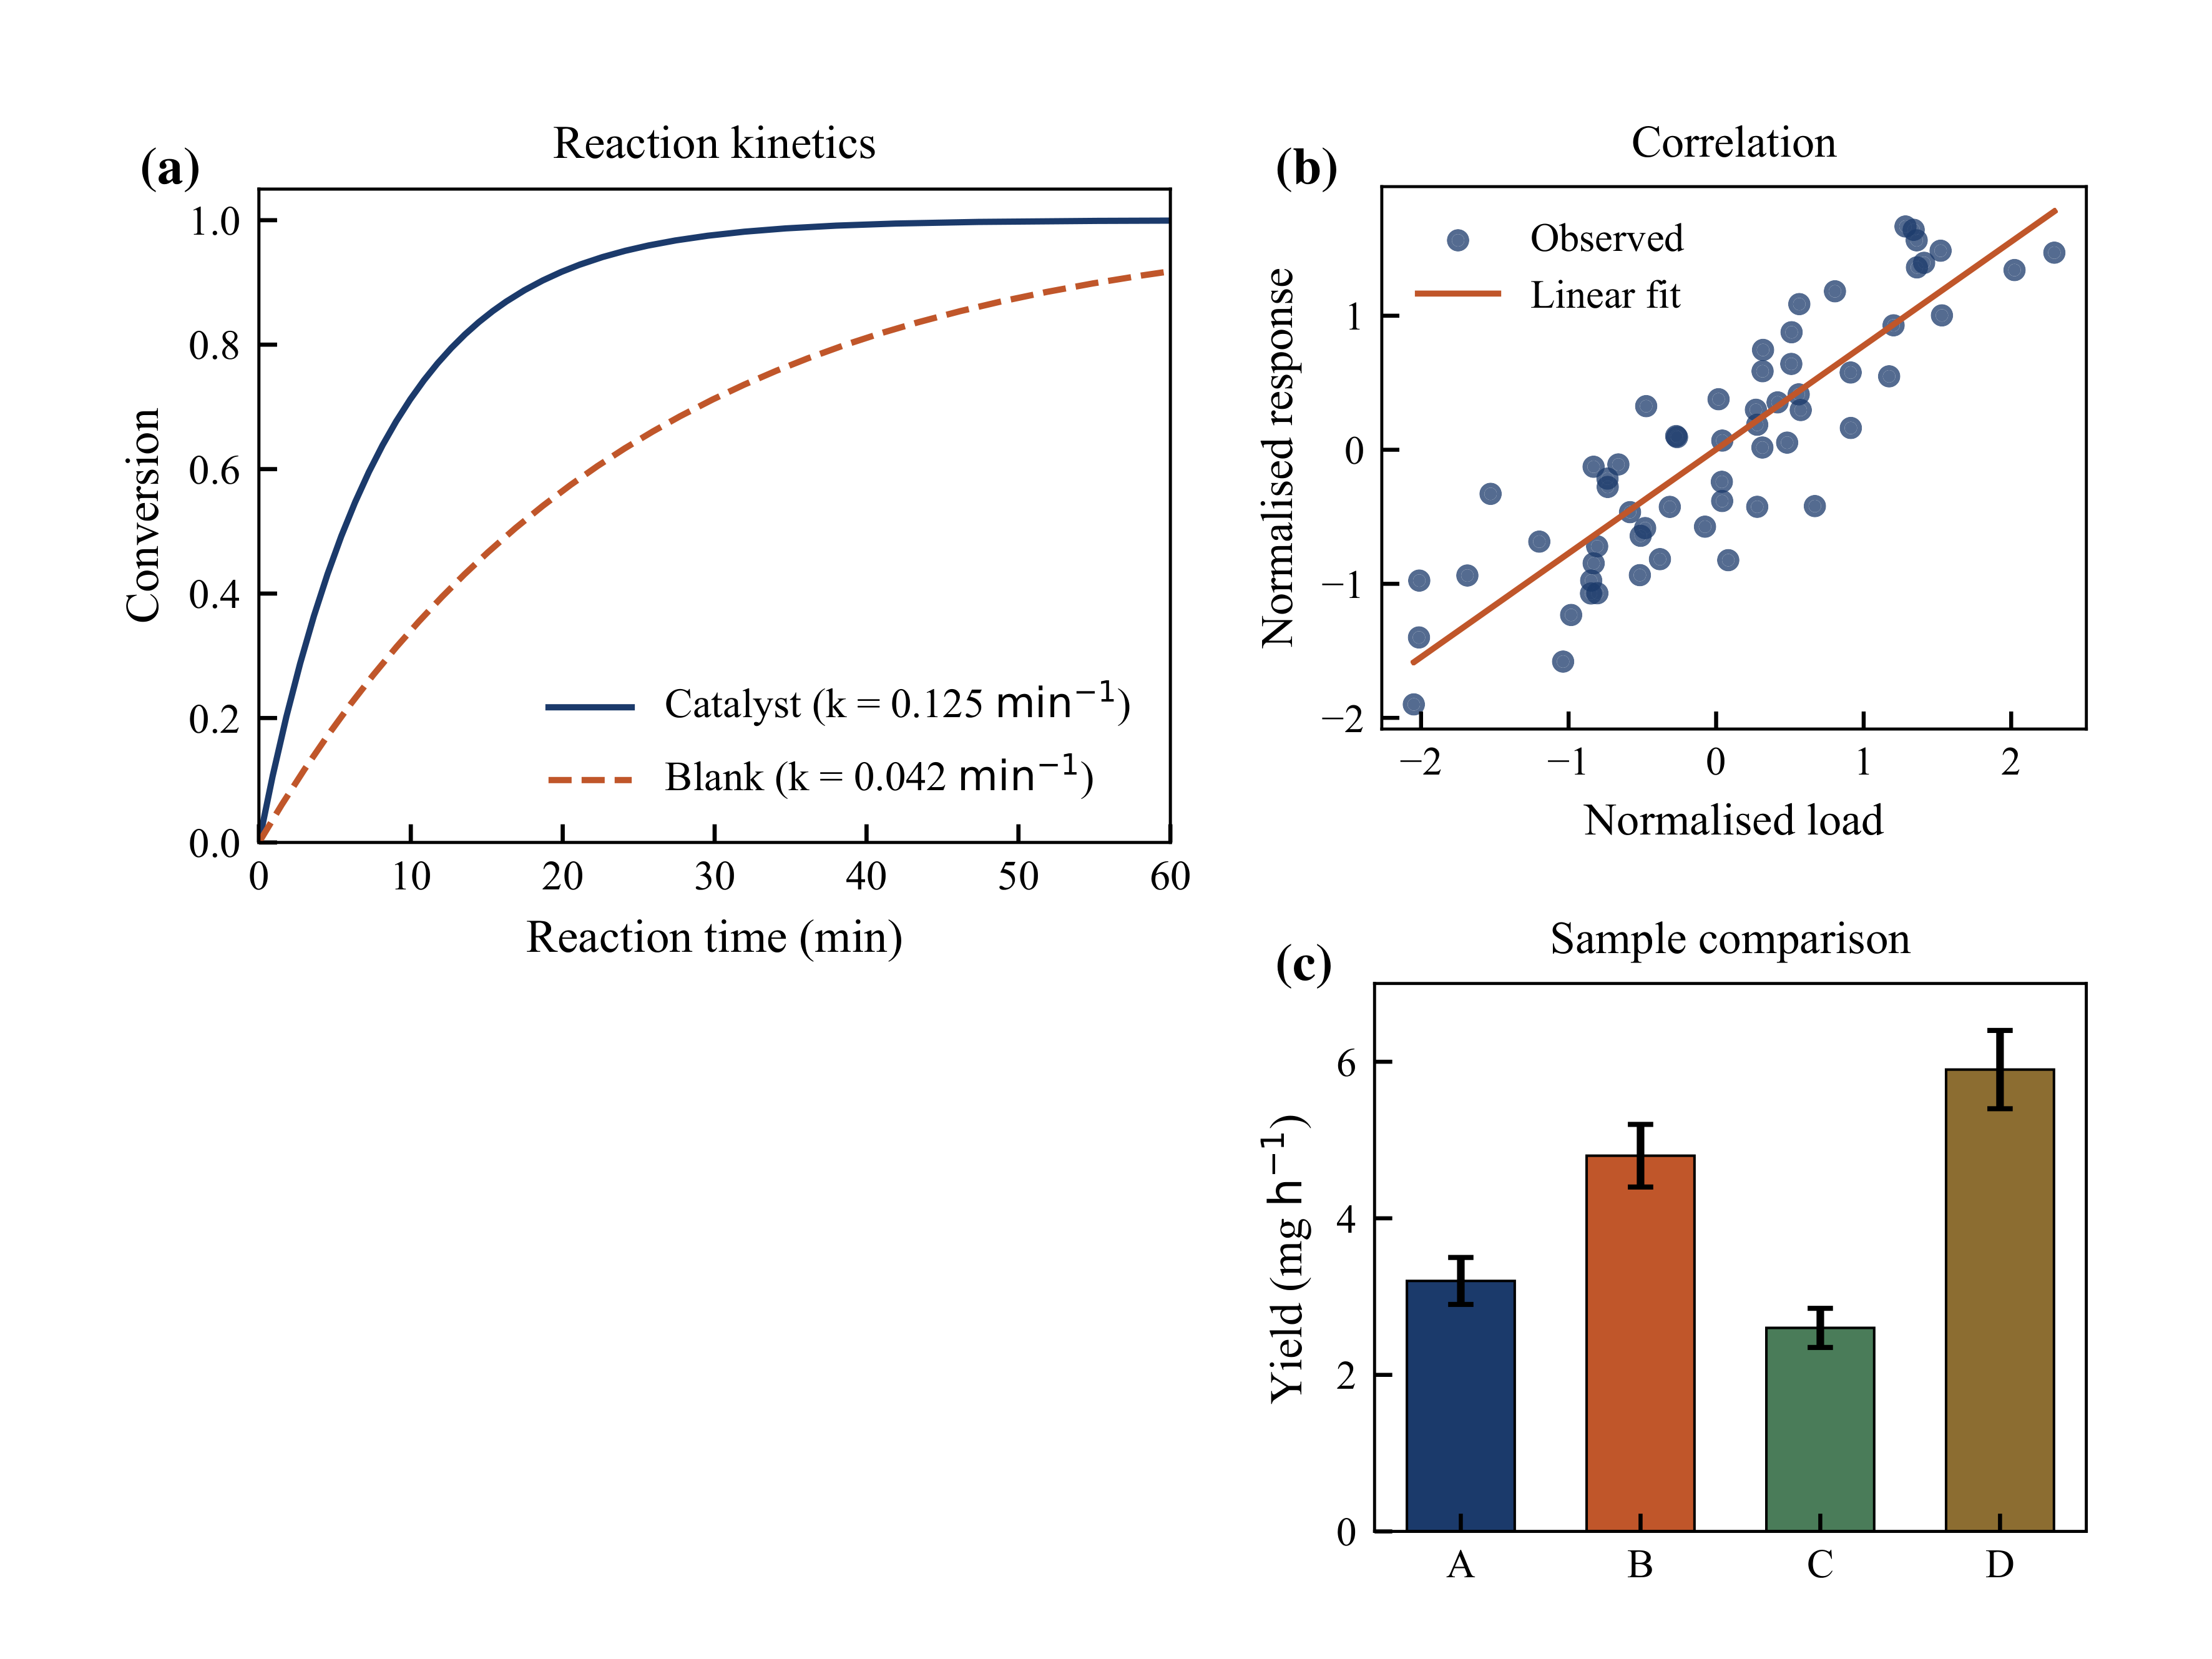
150 × 112.5 mm
- (a)
Fig1_kinetics.pdf80 × 57.6 mm 0.9163 - (b)
Fig2_correlation.pdf59.0894 × 51.573 mm 0.9646 - (c)
Fig2_yield.pdf58.4941 × 47.279 mm 0.9745
Automated Publication Pre-Flight Checks
Type sizes, line weights and layout are checked before you export.
lab-publication-v1 1.0.0
- error cleared (a) (b) (c) Figure text at an effective 7.72pt is not above the absolute floor of 8pt
- suggestion cleared (a) (b) The profile expects legend_text to be bold (currently normal)
- warn cleared (a) (b) (c) The effective line width 1.20pt is not one of the profile's steps (0.5/0.75/1/1.5pt) The effective line width 0.53pt is not one of the profile's steps (0.5/0.75/1/1.5pt)
- suggestion cleared (a) (b) The axis title “Conversion” is not in the profile's “Title (unit)” form
- warn cleared (a) (b) The legend's effective font size 7.72pt is outside the profile's 8.5–9pt
- suggestion cleared (a) All 2 lines are drawn without markers, which is hard to tell apart in black-and-white print or for colorblind readers — consider markers or distinct line styles
- suggestion cleared (b) There is a fitted curve but no confidence band — submissions usually require the uncertainty of the fit
error 1 · warn 2 · not_verifiable 0 · suggestion 4 · blocking true error 0 · warn 1 · not_verifiable 0 · suggestion 4 · blocking false
- 1 raised 12 → 9 pt blocking true
- 2 raised 22 → 9.5 / 10 pt blocking false
Single-Source PDF & PNG Output
The PDF keeps real, selectable text, formulas included. The PNG is rasterised from that same PDF, so the two formats show the same figure.
-
Fig1_page.pdf150 × 112.5 mm · 425.2 × 318.9 pt 291 characters of real text · 96.0 KB -
Fig1_page.png3544 × 2658 px · 600 dpi 306.2 KB -
Fig1_page_proof.jsonlab-publication-v1 1.0.0 error 1 · warn 2 · not_verifiable 0 · suggestion 4 · blocking true
The launch film
Edit figures visually. Keep scripts untouched.
Choose a desktop version
Intel Mac version Other versions and checksums
Free & Open Source · 100% Local Execution
Open source under AGPL-3.0. The figures and PDFs you make with it are entirely yours.
Tavotto is 100% free and open-source—download and use it anytime without sharing your email. We’re exploring a more powerful paid tier, though features, pricing, and timeline are still being evaluated. Leave your email if you're interested. We’ll only send an update once there's concrete news—no spam, ever.
One-time update only. Zero spam.